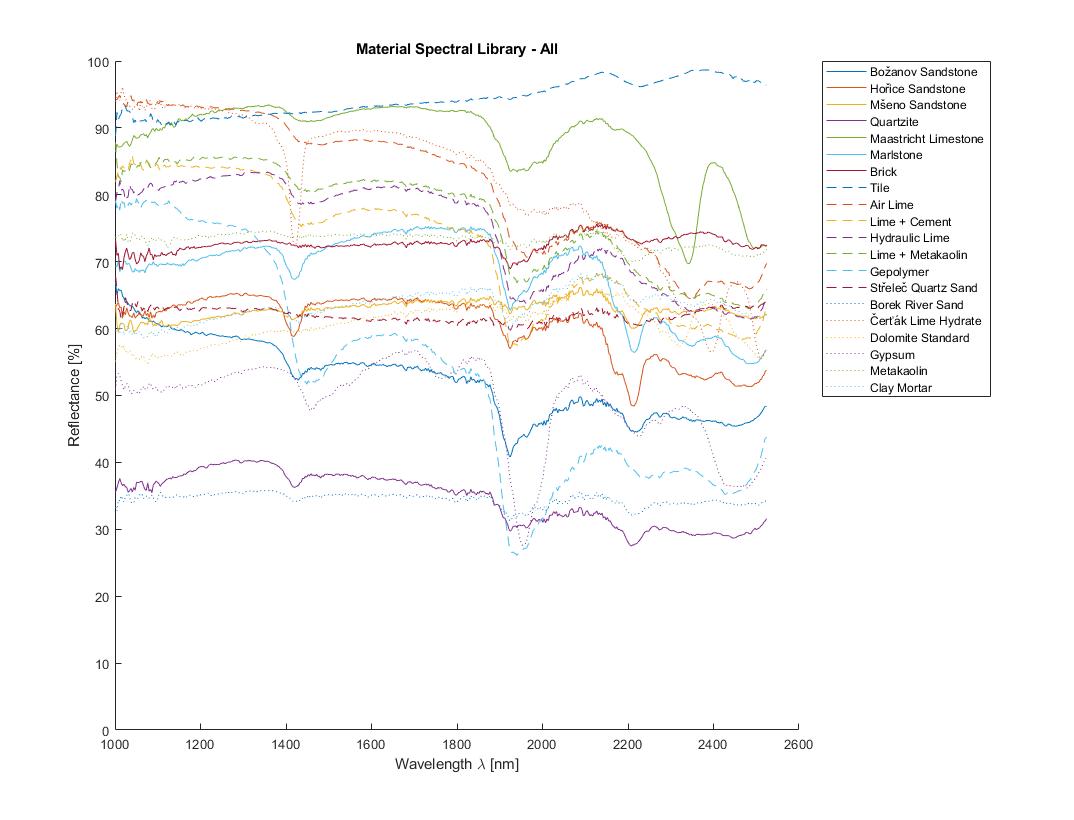
In order to analyse material samples from Central Europe a CTU Material Spectral Library was created. The main goal of this library is to provide spectroscopic information about materials that were used to produce historical and up to date plasters and mortars. This library is available after request for all interested individuals. Requests should be sent to eva.matouskova@fsv.cvut.cz and will be delivered in a txt format.
1. Characteristics
For the spectral library creation, a CTU reflectance spectroscopy measuring device was used. It is an OceanOptics NIRQuest spectrometer with a reflectance probe, for more information see chapter 4.2.
The spectral library consists of 20 materials that are commonly used for plaster and mortar production in the area of Central Europe (Božanov , Hořice and Mšeno sandstone; Quartzite; Maastricht limestone; Přední Kopanina Marlstone; Brick; Tile; Air lime, Lime + Cement binder, Hydraulic lime, Lime + Metakaolin binder mortars; Geopolymer (Střeleč sand); Střeleč quartz sand; Borek river sand; Čerťák lime hydrate; Dolomite; Gypsum; Metakaolin L05; Clay mortar Claytec) This set was created and delivered by the Institute of Theoretical and Applied Mechanics of the Czech Academy of Sciences, Department of Material Research.
2. Library creation procedure
Each sample’s final spectral curve was computed from a set of 15 measurements at different points. These measurements were done with respect to the material to clearly determine the nature of the sample and to provide overall information regarding its spectral signature. Each point measurement was an average of 10 individual readings.
White (Spectralon 99,9% reflectance) and dark reference calibration was performed before and after each material. Measuring and calibration procedures is explained in detail in chapter 4.2.5
3. Data quality and processing
Each material data was processed using MATLAB scripts to determine the average spectral curve. It is an arithmetic average from all 15 measurements. The data quality is shown using a standard deviation and a 2,5 multiple is used as a quality level determination argument. In the MATLAB script remote measurements are excluded from calculations, although this was not needed when the library was created since point measurements were chosen very precisely and if a distant measurement occurred it was immediately replaced in order to provide 15 measurements for average.
Due to high noise in spectral range 900 -1000nm caused by the device sensitivity (see chapter 4.2.6) the library provides information in 1000 – 2500nm spectral range.
4. Data verification - Scanning electron microscope (SEM) analysis
A Scanning electron Microscope (SEM) analysis was used to verify and evaluate spectroscopy results. This is why every material sample was analysed in the laboratory and element composition data were obtained. Based on Energy Dispersive Microscopy (EDS), that is a standard procedure for identifying and quantifying composition of sample areas of a micron or less. The characteristic X-rays are produced when a material is bombarded with electrons in an electron beam instrument.